This article put a summary on Floor Covering Weekly‘s Industry Trends & Market Intelligence 2016 FCW Report. A comprehensive trade publication covering the flooring industry’s business landscape, market trends, and strategic developments. It includes industry news, market research data (with ReCo Market Intelligence Report), consumer behaviour analysis, and product innovations across all major flooring categories in United States.
- Millennials as a Market Force
- Digital Influence on Flooring Sales
- ReCo Market Intelligence Report: Key Findings
- The Retail Sales Associate's Influence
- Top Brands by Category
- Industry Trends: Manufacturing & Investment
- Sales Tactics & Personality-Driven Selling
- Flooring-Specific Software Drives Profitability
- Omnichannel Strategy: Retail + Partnerships
- Hardwood Finishes: Technology-Driven Differentiation
- LVT Category Growth & Performance
- Profitability Strategies for Dealers
- Legal Considerations: "Paid in Full" Checks
- International Opportunities: DACF / Domotex Asia
- Strategic Takeaways for Dealers
Millennials as a Market Force
Millennials, ages 18-34, now represent the largest generation and are reshaping the flooring industry’s future. With approximately 75.4 million people, they’ve surpassed Baby Boomers (74.9 million) and are driving significant economic changes. Already accounting for 15 percent of all spending, their share is expected to reach 30 percent within five years, and they’re purchasing homes at higher rates than any other generation.
Who Are Millennials?
Millennials are technologically native, digitally connected, and socially aware. Key characteristics include:
- Digital Integration: 40 percent prefer buying everything online; 50 percent use smartphones while shopping to research products
- Social Trust: Electronic reviews and peer opinions matter more than salesperson advice
- Interactive Preferences: Three times more likely to be influenced by touch-screen displays in stores
- Diversity: One in four American counties now have majority-minority youth populations under age 20
- Employment & Homeownership: 73 percent employed; 37 percent own homes; 38 percent have children
- Brand Loyalty: 44 percent loyal to brands they purchase; 52 percent choose quality over price
Shopping Behavior Differences from Boomers
Unlike Baby Boomers—who have higher incomes but now prioritize travel and retirement—Millennials are budget-conscious and price-sensitive, often juggling student loans and multiple projects. Key behavioral differences include:
| Attribute | Millennials | Baby Boomers |
|---|---|---|
| Purchase Driver | Price; speed of installation | Quality; comprehensive customization |
| Decision Timeline | Fast (expect installation within days of purchase) | Deliberate; quality-focused |
| Shopping Partner Role | Both partners equally involved in decision | Traditionally female-led decisions |
| Research Method | Online reviews, DIY blogs, social media | TV/print advertising; trusted salespeople |
| Design Inspiration | Pinterest, Houzz, HGTV; influencers like Joanna Gaines | Traditional home magazines |
This shift requires retailers to increase inventory, offer better/better/best pricing tiers, and respect faster sales cycles.
Digital Influence on Flooring Sales
The internet has transformed how consumers discover, research, and purchase flooring. While online sales represent less than 3 percent of total floor covering sales, digital research influences the vast majority of transactions.
Consumer Online Research Patterns
About 50 percent of showroom visitors have already browsed the retailer’s website before visiting. Key research platforms include:
- Visual Inspiration Sites: Pinterest, Houzz (consumers save images of design ideas, particularly influenced by celebrity designers like Joanna Gaines on Instagram)
- Information Resources: HGTV blogs, DIY Network videos
- Trust Builders: Angie’s List, Better Business Bureau reviews, Google ratings
- Most Common Search: “Flooring near me“—customers want local experience after online research
Why Online Research Doesn’t Replace In-Store Visits
Despite extensive online research, consumers value the physical experience of seeing and touching flooring samples in person. Retailers report:
- Customers want to verify information (DIY blogs sometimes contain inaccurate information, e.g., outdated carpet-allergy claims)
- Larger product selection available in stores than suggested by research
- Touch-screen displays and visual merchandising drive purchasing decisions
Converting Online Leads to Sales
Successful retailers employ specialized “hunter” sales roles to convert web-generated leads:
- Outside sales representatives who bring samples to customers’ homes achieve 80 percent close rates
- Shop-at-home service aligns with customers’ research behaviors
- Cold leads require follow-up; 48 percent of leads receive no follow-up, yet 80 percent of sales occur after the fifth contact
ReCo Market Intelligence Report: Key Findings
The ReCo Market Intelligence Report surveyed 1,071 floor covering retailers (±3.0% margin of error) from February-March 2016. Respondents were primarily floor covering retailers (87.7%), with mean annual flooring sales of $2,909,906.
Respondent Profile
| Category | Finding |
|---|---|
| Business Type | 87.7% Floor Covering Retailers; 8.7% Contractors; 2.2% Home Centers; 1.4% Furniture Stores |
| Fastest Growing Segment | Residential Replacement (58.8%); Builder/New Construction (19.4%) |
| Typical Weekly Customer Traffic | 45.6% serve up to 20 customers/week; 9.8% serve 31-50 customers/week |
| Top Sales Drivers | Residential Replacement (55.5% of sales); Builder/New Construction (20.8%) |
| Distributor Relationships | 40.2% work with more than 8 distributors; 5.1% work with 1-2 distributors |
Sales Alignment & Loyalty Programs
36 percent participate in manufacturer loyalty programs; 33.3 percent in franchise/co-op/buying groups. This reflects increasing consolidation and partnership strategies in the industry.
The Retail Sales Associate’s Influence
The retail sales associate remains the single most influential factor in flooring purchases—a critical insight for dealers.
Brand Request Rates (Across All Categories)
Consumer requests for specific brands are lower than expected across all categories. This indicate that the market still has significant opportunities for private label flooring brands. Consumers overall has not have a strong preference over branded flooring products.
| Category | Often/Very Often Requesting Brand |
|---|---|
| Carpet | 27.8% |
| Vinyl/Resilient | 20.3% |
| Laminate | 18.5% |
| Hardwood | 18.1% |
Retailers Actively Switching Brands
Retailers frequently attempt to sway customers away from stated brand preferences.
| Category | Often/Very Often Attempting Switch |
|---|---|
| Carpet | 32.8% |
| Vinyl/Resilient | 25.4% |
| Laminate | 28.8% |
| Hardwood | 26.3% |
This suggests retailers prioritize margins and inventory over brand loyalty, a tactic that works more often than industry observers expect.
Top Brands by Category
Carpet Flooring
Shaw dominates with 47.9 percent of carpet sales; Mohawk follows with 36.2 percent. Together, these two control nearly 84 percent of the market. The top supplier typically represents 61.2 percent of a retailer’s carpet sales, indicating high concentration.
| Brand | Sales Share |
|---|---|
| Shaw | 47.9% |
| Mohawk | 36.2% |
| Beaulieu | 3.2% |
| Tuftex | 3.2% |
Average Carpet Sale: $2,205 (mean); most common range: $1,501–$2,000 (21.4%)
Vinyl Sheet Flooring
Armstrong leads vinyl sheet with 68.4% of retailers carrying it; Mannington (56.6%) follows. Unlike carpet, vinyl shows more distributed market share, suggesting category fragmentation.
| Brand | Sales Share |
|---|---|
| Armstrong | 68.4% |
| Mannington | 56.6% |
| Shaw | 40.8% |
| IVC | 39.5% |
Average Vinyl Sale: $1,478 (mean); most common range: $1,001–$1,500 (22.3%)
Laminate Flooring
Shaw (69.0%) and Armstrong (56.4%) dominate laminate, followed closely by Mohawk (55.3%) and Mannington (54.3%).
| Brand | Sales Share |
|---|---|
| Shaw | 69.0% |
| Armstrong | 56.4% |
| Mohawk | 55.3% |
| Mannington | 54.3% |
Average Laminate Sale: $1,517 (mean); most common range: $1,001–$1,500 (27.5%)
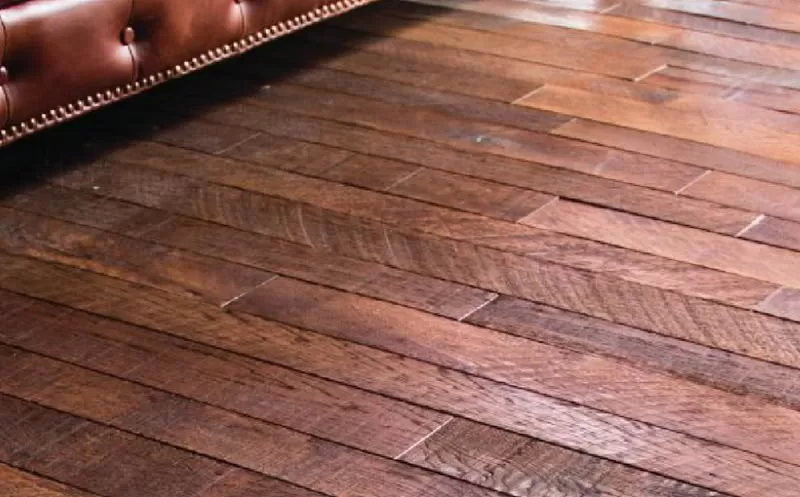
Hardwood Flooring
Shaw (54.9%) and Armstrong (48.2%) lead hardwood sales. This category shows more diverse competition than carpet, with Bruce (32.8%), Mannington (29.6%), and USFloors (21.1%) capturing significant shares.
Average Hardwood Sale: $2,955 (mean)—highest among all categories; most common range: More than $3,500 (44.0%)
Luxury Vinyl Tile (LVT)
Armstrong (54.1%), Shaw (49.8%), and Mannington (49.2%) dominate LVT, reflecting the category’s rapid growth. LVT represents the fastest-growing segment and is attracting major manufacturer investment.
| Brand | LVT Category Sales Share |
|---|---|
| Armstrong | 54.1% |
| Shaw | 49.8% |
| Mannington | 49.2% |
| Mohawk | 31.8% |
Average LVT Sale: $1,719 (mean); most common range: $1,501–$2,000 (24.8%)
Ceramic Tile
Daltile dominates tile with 77.7% of retailers carrying it, far exceeding competitors. American Olean (56.5%) and Mohawk (42.4%) follow distantly, indicating heavy market consolidation in tile.
Average Ceramic Tile Sale: $2,030 (mean); most common range: $1,501–$2,000 (17.6%)
Industry Trends: Manufacturing & Investment
Domestic LVT Production Growing
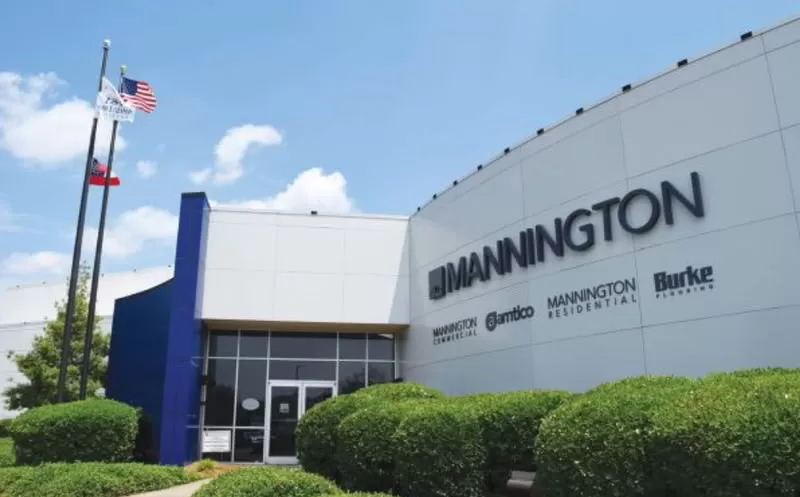
Mannington’s $65 million investment in its Madison, Georgia LVT facility exemplifies the industry’s shift toward domestic manufacturing.
Some key metrics:
- Currently: 70% of residential LVT and 100% of commercial LVT from Mannington are made in USA
- Target: Mannington aims at 90% of residential LVT products are produced in USA by year-end
- Job Creation: More than 400 new manufacturing jobs are created at Madison facility alone
Core Values Drive Expansion
Mannington’s century-old values emphasize “doing the right thing and controlling your own destiny.”
This commitment to domestic manufacturing reflects:
- Quality control advantages in vertical integration
- Build better supply chain resilience
- Job creation and community investment (e.g., donations to Georgia Zoo and Morgan Hospital)
Quote from Keith Campbell, Mannington Chairman: “A job is dignity. When you give someone a job, you give them dignity, a roof over their heads, a future for their family.”
Sales Tactics & Personality-Driven Selling
Linking Personality Types to Carpet Styles
Successful salespeople connect customer’s personality traits to specific carpet styles. This can help to accelerate sales decisions by customers.
| Personality Type | Carpet Style | Rationale |
|---|---|---|
| The Explorer | Frieze | Unique texture, modern look; appeals to adventurous tastes |
| Old Faithful | Nylon | Most popular in America; proven, safe choice |
| The Cosmopolitan | Loop Pile | Polished, professional look; fits sleek office environments |
| Mr. Wonderful | Sisal | Rustic, natural; simple, chic; low maintenance |
Flooring-Specific Software Drives Profitability
Why Retailers Adopt Flooring-Specific Software
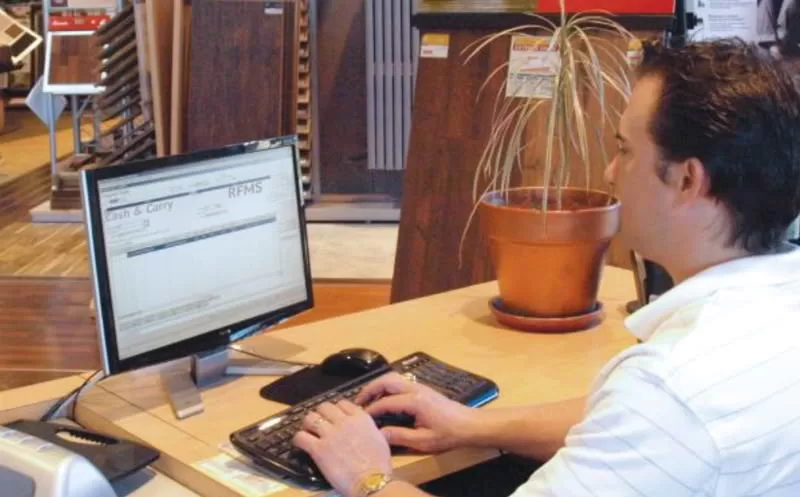
Most retailers don’t use flooring-specific software due to learning curves with technology. Those who adopt it report significant benefits:
| Benefit Category | Impact |
|---|---|
| Inventory Control | Eliminate double ordering; reduce shrinkage |
| Job Costing | Increase profit margins by accurately tracking labor costs |
| Lead Management | Capture lost sales opportunities through automated follow-up |
| Financial Accuracy | Generate timely, accurate financial statements |
| Time Savings | Reduce busy work; enable focus on sales |
Key Features Driving Adoption
- Cloud-based access (e.g., RollMaster Cloud) enables remote operations and real-time data
- Mobile solutions (tablets/smartphones) enhance in-home estimates and showroom efficiency
- B2B integration through fcB2B automates vendor invoices and inventory updates
- CRM modules track customer follow-ups and close rates (80% of sales occur after 5th contact)
Real-World Impact: Case Studies
Randy’s Carpets & Interiors (Iowa) replaced home-grown systems with RollMaster:
- Streamlined job costing and reporting
- Integrated purchase orders across receivables/payables
- Improved repeat-customer consistency through “View Last Price” feature
White River Flooring (Arkansas) adopted QFLoors in 2007:
- CEO credited software adoption with company growth
- User-friendly interface and ease of learning drove selection over QuickBooks
Omnichannel Strategy: Retail + Partnerships
Empire Today × JCPenney Partnership
Empire Today launched 7 pilot stores within JCPenney locations (Tampa, FL and Washington, D.C. metro areas) to tap into:
- Millions of annual store visitors already thinking about home improvement
- Complementary partnerships: Ashley Home Furniture, GE, and other home brands driving traffic
- Localized inventory: 10,000+ SKUs across carpet, hardwood, laminate, vinyl, and tile in ~1,000 sq ft spaces
- Market customization: D.C. emphasizes carpet; Tampa emphasizes tile (market preference-driven)
Retail lesson: Showroom design matters—product grouped by category (not manufacturer) improves customer navigation and experience.
Hardwood Finishes: Technology-Driven Differentiation
Evolution of Finishing Technology
Hardwood finishes have become a critical competitive differentiator, with manufacturers investing heavily in proprietary formulations that balance aesthetics, performance, and sustainability.
Key Finish Trends
| Trend | Example | Benefit |
|---|---|---|
| Oil-Look with Low Maintenance | Mirage DuraMatt; Mohawk Opa-lux | Visual appeal of oil finish with urethane durability and easy care |
| Nano Technology | Armstrong Nano coating; Mirage Nanolinx HD | Superior scratch resistance; extended warranties |
| Environmental Certification | Mercier Pure Expression (Greenguard Certified) | Green certification + oil finish appearance + durability |
| Multi-Attribute Design | Mannington ScratchResist (aluminum oxide) | Addresses multiple performance challenges simultaneously |
| Antique Effects | Struxtur water-based urethane with two-stain technology | Fashion-forward; differentiated market positioning |
Quote from Brian Jones, Armstrong: “Ultimately, the finish is what you walk on; that’s what protects the wood floor from real damage over time. Performance is key.”
Warranty Extensions: Better finishes justify higher warranties (up to 35 years for pre-finished products) due to superior durability.
LVT Category Growth & Performance
Why LVT Dominates
Luxury Vinyl Tile (LVT) is the fastest-growing flooring category due to convergence of:
- Waterproof Performance: Suitable for bathrooms, kitchens, basements, moisture-prone areas
- Aesthetic Versatility: Realistic wood, stone, and slate visuals
- Ease of Maintenance: Simple cleaning; low maintenance requirements
- Installation Speed: Floating systems enable quick deployment
- Commercial + Residential + Multifamily Appeal: Works across all market segments
Wearlayer Performance (Thickness Matters)
Wearlayer thickness (measured in mils) directly correlates to durability and price point:
| Wearlayer | Use Case | Performance |
|---|---|---|
| 3mil | Budget residential | Basic protection |
| 12mil | Standard residential | Moderate scratch resistance |
| 20mil | High-end residential | Strong durability |
| 28mil | Commercial (Metroflor Aspecta) | Extreme durability |
Example Technologies:
- Armstrong Vivero: Diamond 10 technology for extreme scratch resistance
- EarthWorx TuffShield: Aluminum oxide crystals (0.15-0.8mm thickness)
- Mannington ScratchResist: Aluminum oxide harder than granite; passes quarter-scratch test
Profitability Strategies for Dealers
Building the “Profit Bucket”
Every product and service sold should include profit built into pricing. Key strategies include:
Labor & Warranties
- Charge for labor warranties above industry standard: 5-year, 10-year, or lifetime warranties cost more and justify higher pricing
- Discount strategy: If customers resist pricing, offer lower warranties (e.g., drop from lifetime to 1-year) rather than discounting margin
Documentation & Disposal Fees
- Documentation fee: $20–$40 per invoice (drops to bottom line; achievable on 90% of orders)
- Landfill/recycling fee: Flat fee ($35–$75) or per-square-foot (10–25¢ per sq ft)
- Estimated annual impact for $4M store**: **$135,000 additional profit (2,000 tickets/year × 90% capture rate × $75 combined fees)
Payment Collection
- Collect all money prior to installation to:
- Avoid line-of-credit interest
- Reduce service issues by 60% (customers don’t dispute small problems if unpaid balance outstanding)
- Save time on collection efforts
Key Insight: “We’re in a pennies business; stop stepping over dollars to pick up pennies.”
Legal Considerations: “Paid in Full” Checks
Accepting Partial Payments with Reservation of Rights
Under the Uniform Commercial Code (Article 1, General Provisions), dealers can accept “paid in full” checks for disputed amounts while reserving the right to sue for the balance.
Method: Endorse check “Under protest with all rights reserved“—this explicit reservation should prevent the check from operating as an “accord and satisfaction” (final settlement).
Important Note: Interpretation varies by state. New York allows full reservation of rights; other states maintain the old rule that “paid in full” checks automatically settle disputes.
Recommendation: Consult local attorney familiar with commercial law before adopting this strategy.
International Opportunities: DACF / Domotex Asia
U.S. Distributors Tour Chinese Factories
Floor Covering Institute organized a distributor trip to Domotex Asia/China-floors (DACF) featuring factory tours and trade show attendance. Key takeaways:
- Technology Advancements: Chinese manufacturing capabilities far exceed industry perception; quality and innovation impressive
- Partnership Opportunities: Distributors now developing private-label programs with Chinese manufacturers
- Import Insights: Learning from experienced distributors about:
- Working directly with factories vs. agents
- Vetting quality and capability
- Negotiating terms and timelines
Quote from John Sher, Adleta: “It had been two years since I toured facilities in China, and the upgrades and enhanced technology in that span of time was incredible.”
Strategic Takeaways for Dealers
- Millennials Are Here: Budget-conscious, tech-savvy, and decision-ready. Optimize for speed, price transparency, and digital touchpoints.
- Sales Associates Still Rule: Despite online research, retail staff influence is paramount. Invest in training, personality-matching, and lead conversion processes.
- Embrace Software: Flooring-specific software drives profitability through inventory control, job costing, and lead management. Cloud-based access is now expected.
- LVT Dominance Continues: Growth, versatility, and performance make LVT a category to prioritise. Understand wear layer technology and finishes.
- Premium Finishes Command Price: Invest in differentiated finishes (nano, oil-look, multi-attribute) to justify higher price points and extend warranties.
- Omnichannel Opportunities: Partnerships (e.g., Empire Today × JCPenney) and shop-at-home services capture digitally-researched customers who still value physical experience.
- Profitability Through Details: Documentation fees, disposal charges, and labor warranties add $100K+ annually without discounting margins.
- Domestic Manufacturing: Manufacturers’ investments in U.S. production (Mannington, Armstrong, Shaw, Mohawk) enable marketing advantages and supply-chain resilience.